
National Travel Attitudes Study Wave 9 Cycling

48% of respondents to the National Travel Attitudes Study (NTAS) said that safety concerns were the main reason they were discouraged from cycling.
Safer roads would encourage more people to cycle, selected by 61% of respondents. The next most popular option was off-road and segregated cycle paths, at 52%.
29% said that more cycle lanes in their area would be likely to encourage them to cycle more (see graphic above), but 11% said there were enough cycle lanes already. Of course the 11% may well be non-cyclists, or even hostile to cycling.
About the NTAS
The figures come from the Cycling results of Wave 9 of the NTAS. It collected responses from 2,011 people in August and September 2023.
Seven out ten respondents say they never ride a bicycle.
Bicycle Ownership
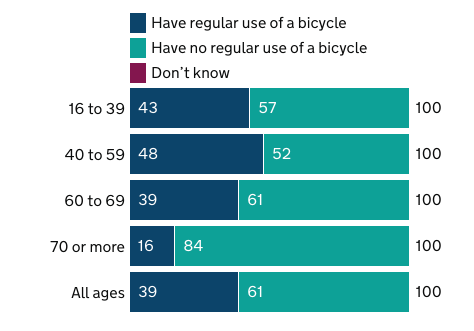
39% of respondents as a whole had access to a bicycle.
The percentages differ according to age bracket, as shown in the graphic above. Only 16% of those aged 70+ had regular use of a bicycle.
Respondents with lower household income are also less likely to have regular use of a bicycle.

Use of Bicycles
NTAS shows that:
- 18% of respondents travel by cycling at least once a month but
- 70% say that in an average week they never travel by cycling
Asked how confident they were when riding a bicycle:
- 56% said they are very or fairly confident
- 36% said they are not very or at all confident and
- 7% said they had never ridden a bicycle
The confident cyclists took most of the trips and rode most of the cycle miles.
Encouragements to Cycle More
Respondents were presented with a series of options, and asked to say if they would encourage them to cycle, or cycle more.
As noted at the top of this post, the most popular option was safer roads, at 61%. The second most popular factor is off-road and segregated cycle paths (52%).

It’s a long list of factors, and I’ve cut off the last few least popular options from the graphic – cheaper hire bicycles, cycle maintenance courses, bicycle training and better cycle hire facilities.
I suspect many people haven’t really thought in depth about what would encourage them to cycle, but if all the stars aligned (safe infrastructure, convenient facilities), they would cycle.
Respondents from ethnic minorities responded more favourably to encouragements to cycle than respondents as a whole.
Individuals from ethnic minorities are more likely than white respondents to cycle at least annually, but white respondents take more trips and travel further.
Reasons Why People Don’t Cycle (More)

In the NTAS report, reasons why people don’t cycle (more) come after encouragements to cycle more. This feels back-to-front.
The top reason not to cycle (more) was safety, cited by 48% of all respondents. It has increased from 25% in 2021.