
CO2 from Transport up 10% in 2021
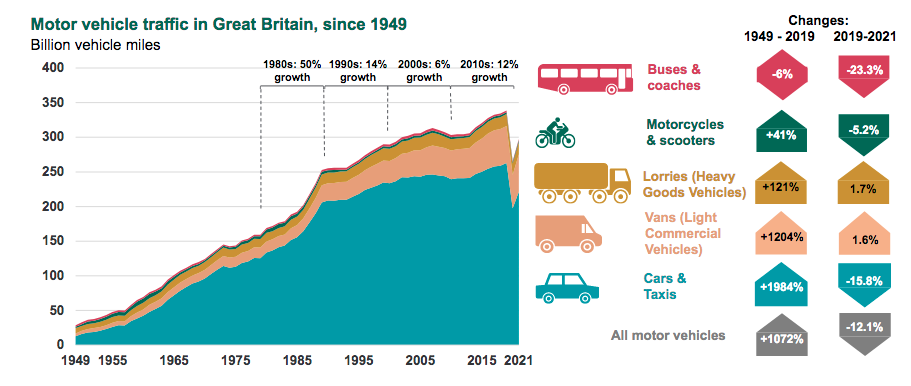
Provisional figures for greenhouse gases estimate that emissions from transport increased by 10% in 2021 compared with 2020. That’s according to the DfT’s Road Traffic Estimates 2021.
UK emissions as a whole increased by 6.3%. Road transport was already the biggest single source of greenhouse gases, accounting for 31% of the UK total in 2020.
Effect of the Coronavirus Pandemic
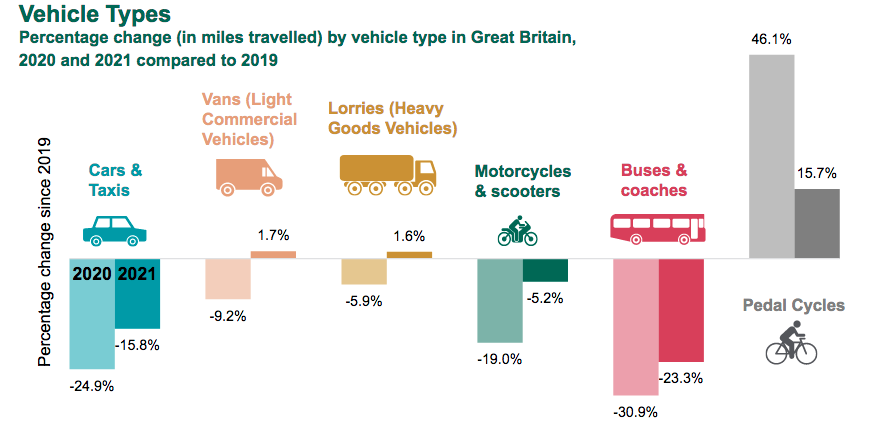
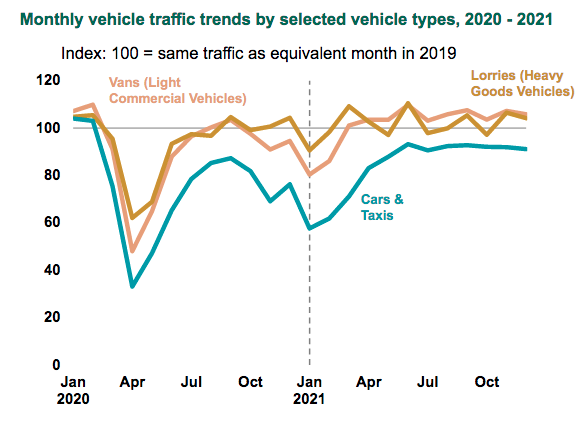
Coronavirus affects these road traffic figures. The first national lockdown began on 23rd March 2020, and travel restrictions that year reduced driving and increased cycling.
The pandemic continued to suppress traffic in 2021 to a lesser extent, with Tier 4 restrictions introduced in January 2021. It should not be forgotten that 2021 is also a ‘Coronavirus year’, and reductions in motor vehicle traffic in 2021 should be considered in the light of the fact and treated with caution.
The DfT’s estimates compare 2021 and 2020 against the last full year unaffected by Coronavirus, 2019.
It can be argued that there is an inverse relationship between volume of traffic and cycling.
This graph breaks down the figures as between different motor vehicle types.
I Would Drive 300 Billion Vehicle Miles
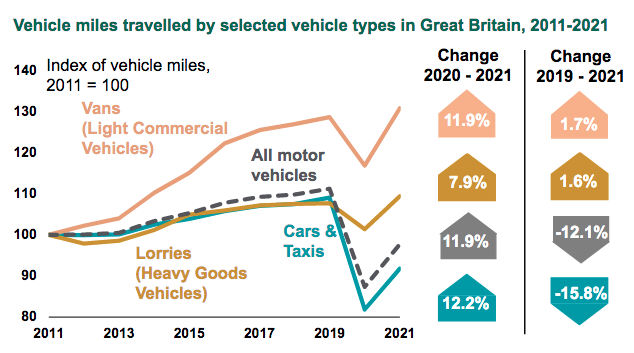
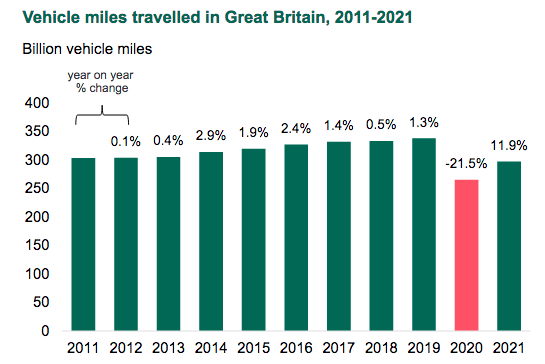
The total number of miles driven on Great Britain’s roads in 2021 was 297.6 billion. This was:
- +11.9% compared to 2020 but
- -12.1% compared to 2019
This graph shows 2020 as an outlier in a trend of increasing miles driven.
Pedal Cycles
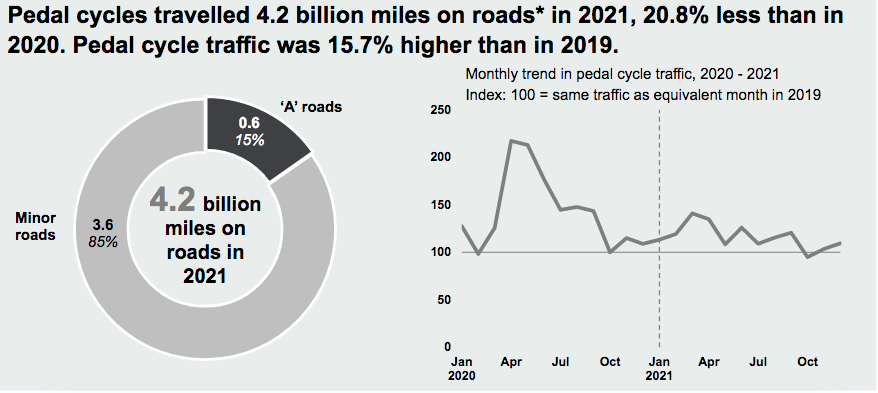
Distance travelled by pedal cycle was:
- -20.8% compared to 2020 but
- +15.7% compared to 2019
The DfT do some really good graphics, but it is unfortunate that they have given the nice colours to polluting forms of transport, and ‘exhaust fume grey’ to cycling, which doesn’t pollute at all.
Another graphic shows that nearly all road cycling is done on minor roads.
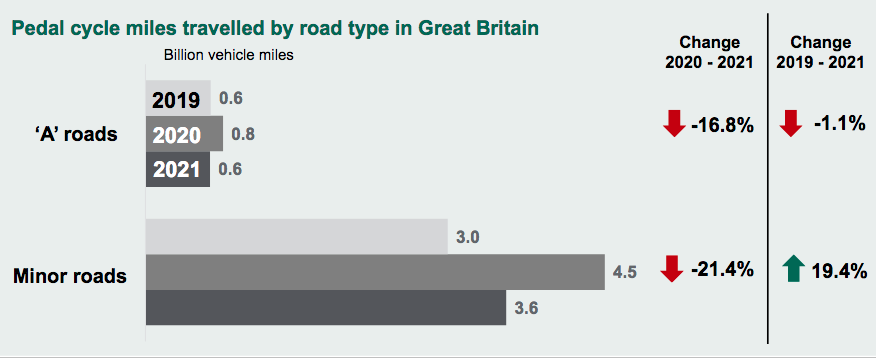
This emphasises the threat to cycling posed by delivery vehicles and commuters using quieter residential roads as rat-runs.
Vehicle Miles Travelled in North & East Yorkshire
| Year | Major Roads | Minor Roads | Total |
|---|---|---|---|
| 2021 | 6.3 billion miles | 3.7 billion miles | 10 billion miles |
| 2020 | 5.5 billion miles | 3.6 billion miles | 9.1 billion miles |
| 2019 | 7.3 billion miles | 4.1 billion miles | 11.4 billion miles |
I’ve taken these figures from statistics provided by the DfT in table tra0103. They appear to cover North Yorkshire, City of York, and East Riding of Yorkshire.
From 2020 to 2021, vehicle miles travelled has increased by 10%. That isn’t a good start.