
Oatlands Consultation Shows Most Respondents Unhappy and Want Change
The results of the Oatlands consultation held in October/November 2022 show that most respondents are unhappy with the way the area is dominated by motor vehicles, and want change.
The consultation results were finally added to North Yorkshire Council’s (NYC’s) website more than a year after the Commonplace survey closed, and ten months after the council received them from consultants WSP who did the work. There is:
The summary of issues and ideas is the most useful. It is divided into these sections:
- Results of the traffic surveys
- Results of the Commonplace consultation
- Context and options
- Current design options
- New ideas
1) Results of the Traffic Surveys
WSP did Automatic Number Plate Recognition (ANPR) surveys to understand vehicle volumes and origins and destinations.
They also did speed surveys, parking surveys, and pedestrian and cycle counts.
Traffic Volumes and Origin & Destinations
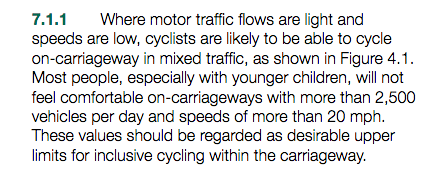
On weekdays, the average traffic volume on Oatlands Drive is 8,841 vehicles. This compares with a maximum of 2,500 vehicles per day for cycling in mixed traffic (i.e. without physically-protected space) to be safe.
Wheatlands Road East sees the next highest traffic volumes, at 1,138 per day.
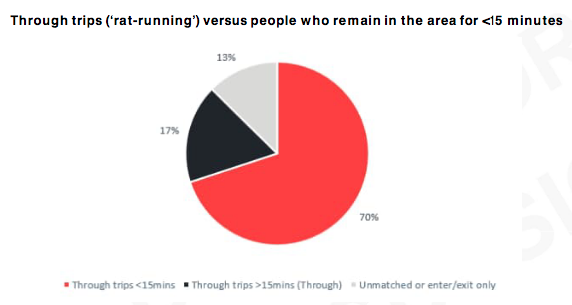
Traffic in the Oatlands area is 70% rat-running – through trips where vehicles remain in the area for less than 15 minutes (see graphic above).
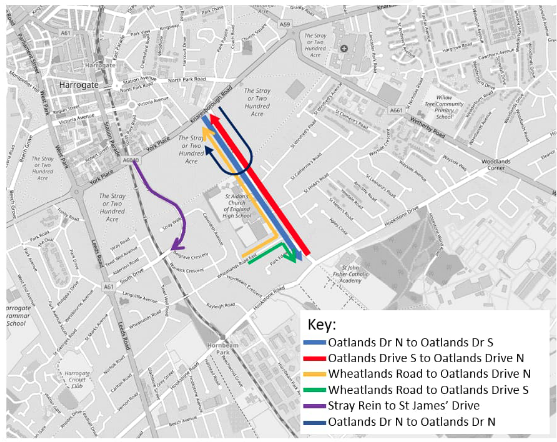
In the morning peak, north to south trips on Oatlands Drive dominate (i.e. turning onto Oatlands Drive from York Place). Later in the day, there are equal numbers of north-south and south-north trips on Oatlands Drive.
Traffic Speeds
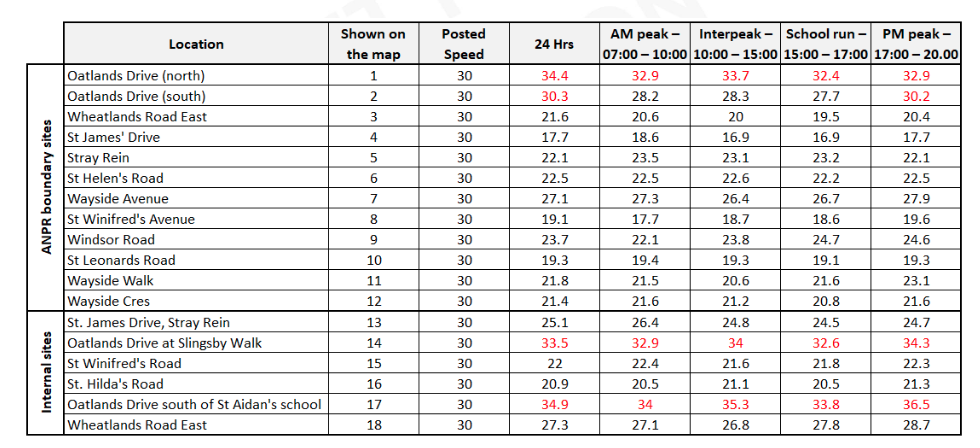
85th percentile speeds on Oatlands Drive are consistently above 30mph. For example, the 85th percentile speed on Oatlands Drive north is:
- 32.9mph in the morning peak when children are walking and cycling to school and
- 32.4mph at afternoon school closing time
Parking
WSP identify parking where it is permitted on the roads in the Oatlands area. It tends to be during the day, suggesting it is not local residents.
If I’ve understood the table correctly, the maximum parking level is 64% of the available spaces. This occurs on St Winifred’s Road, during the period 10am to 3pm.
2) Results of the Commonplace Consultation
During the consultation on the Commonplace platform in Autumn 2022, there were:
- 383 comments made by
- 285 people
Some comments have clearly been excluded because NYC has decided that they were outside the study area. This includes those relating to Hookstone Road and Hookstone Drive, which form the SE boundary of the Oatlands area.
The respondents were:
- 63.3% residents of the area and
- the other one third people who commute or otherwise pass through or visit the area
Younger people were under-represented, with less than 1% of respondents under 24.
WSP say most people wanted change:
‘Most of the people who commented on the map were unhappy with the existing situation, and wanted change. This was apparent in both the responses chosen for the closed questions, and the more detailed comments people provided.
People who visit or travel through Oatlands were most likely to be unhappy with the existing situation, with 71% saying they felt unhappy or dissatisfied with the existing situation, but 51% of residents also felt this way’.
WSP oatlands summary, p12
Only 2.9% of residents and 2.3% of visitors said ‘nothing [is wrong], everything is fine here’.
Key Issues
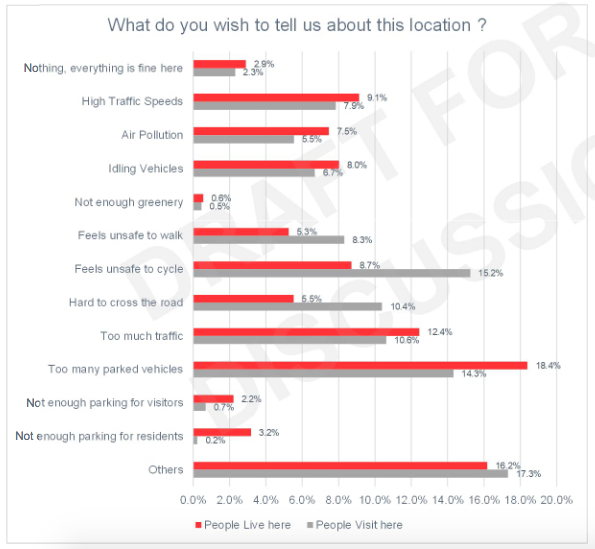
Key issues differ slightly for residents and those who travel through the area.
The top issues for residents were:
- Too many parked vehicles 18.4%
- Too much traffic 12.4%
- High traffic speeds 9.1%
- Feels unsafe to cycle 8.7%
- Idling vehicles 8%
The top issues for people travelling through or to the area were:
- Feels unsafe to cycle 15.2%
- Too many parked vehicles 14.3%
- Too much traffic 10.6%
- Hard to cross the road 10.4%
- Feels unsafe to walk 8.3%
WSP say there is no clear consensus about the biggest problems, but:
‘…people felt that too much traffic, high traffic speeds, unsafe conditions for cycling, unsafe conditions for walking, air pollution, idling vehicles and difficulty crossing the road were all problems.
Many of these issues are clearly linked, and stem from high volumes of motor traffic passing through the Oatlands area’.
WSP oatlands summary, p13
What Solutions are Supported?
The top solutions supported by residents were:
- Less parking 19.6%
- Reduce the amount of traffic 19%
- Slow down traffic 12.6%
The top solutions supported by people travelling through or to the area were:
- Cycle lanes 18.3%
- Less parking 14.7%
- Reduce the amount of traffic 12.9%
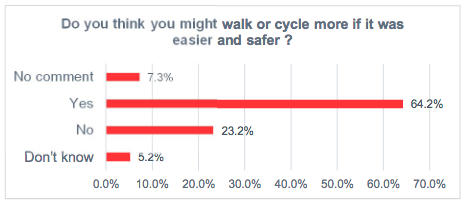
64.2% of respondents thought that they would walk or cycle more if it was easier and safer.
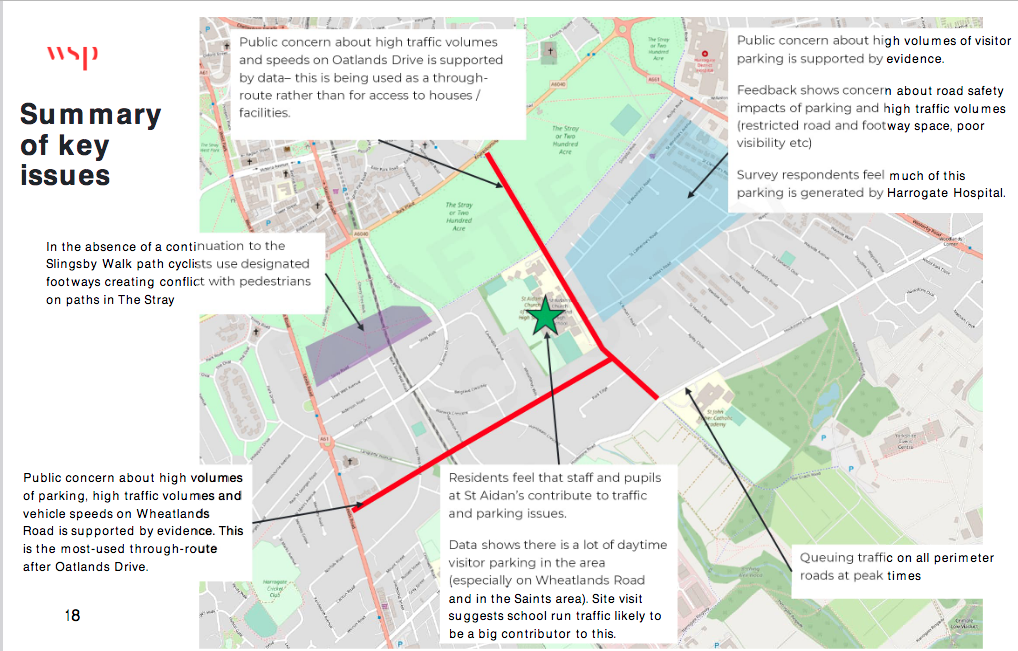
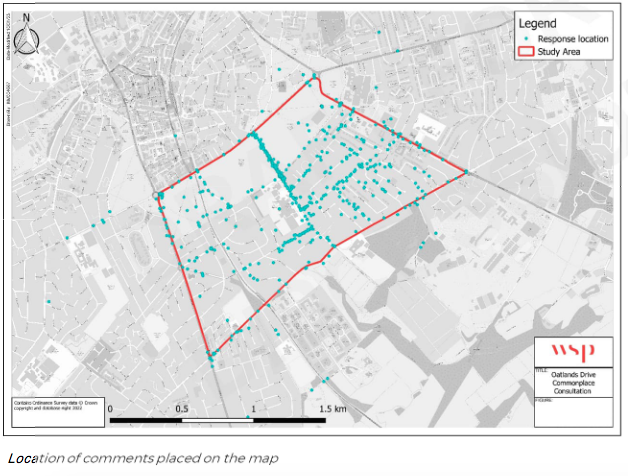
Street by Street Analysis
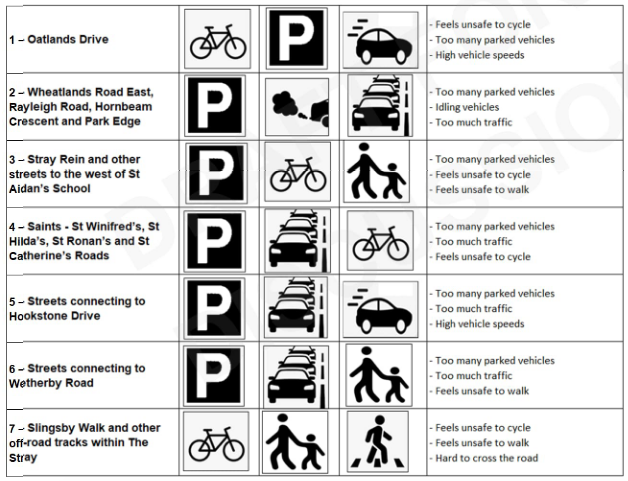
The most comments were received about Oatlands Drive, followed by the Saints area.
The handy graphic above summarises the issues by street/area.
The Need for a Strategy and the Backbone to Implement it
I will deal with the ‘solutions’ part of the WSP report in a separate post.
It is clear from the traffic surveys and the Commonplace consultation that there are problems, and a lot of people have noticed them. The Oatlands area is not active travel-friendly, because it is dominated by motor vehicles.
We need a council with an active travel strategy. NYC should make the case for meaningful change, put options to people, but make it clear that doing nothing (or next to nothing) is not an option.
Oatlands Drive is a route on NYC’s Local Cycling & Walking Infrastructure Plan (LCWIP). This is the opportunity to bring it up to the minimum standards in LTN 1/20 Cycle Infrastructure Design, not tinker around the edges and do nothing meaningful.
Unfortunately we have a council without backbone, drive and determination; a council that is happiest when doing nothing. It will use the fact that there are differing opinions as a reason to do nothing, or next to nothing.
It does not have the will to implement its own LCWIP.
There are some differences between the views of residents and those of people who use the roads to travel to or through the area.
Residents’ views are relevant, but they own their houses not the local roads. They should not be given a veto over proper cycle facilities.
If the council lets residents of each area of Harrogate & Knaresborough veto cycle tracks, we will never end up with a coherent network.
Why Did It Take So Long to Publish the Results?
The WSP reports are dated February 2023, but they were only published by NYC in December 2023.
Why did it take ten months just to publish the results of a consultation?
The solutions proposed by WSP are in a separate post.